

Healthcare Data Breach Statistics – Updated for 2026
The HIPAA Journal has compiled healthcare data breach statistics from October 2009, when the Department of Health and Human Services (HHS) Office for Civil Rights (OCR) started publishing summaries of healthcare data breaches on its website.
 This page is regularly updated to reflect the latest healthcare data breach statistics. These statistics and graphs were last updated on June 19, 2026, and are based on breach data obtained from OCR up to and including May 19, 2026. Check back regularly to get the latest healthcare data breach statistics and healthcare data breach trends.
You can view our 2025 healthcare data breach report here. You can also receive a free copy of our HIPAA Compliance Checklist to understand your organization’s responsibilities under HIPAA.
Trends In Healthcare Data Breach Statistics
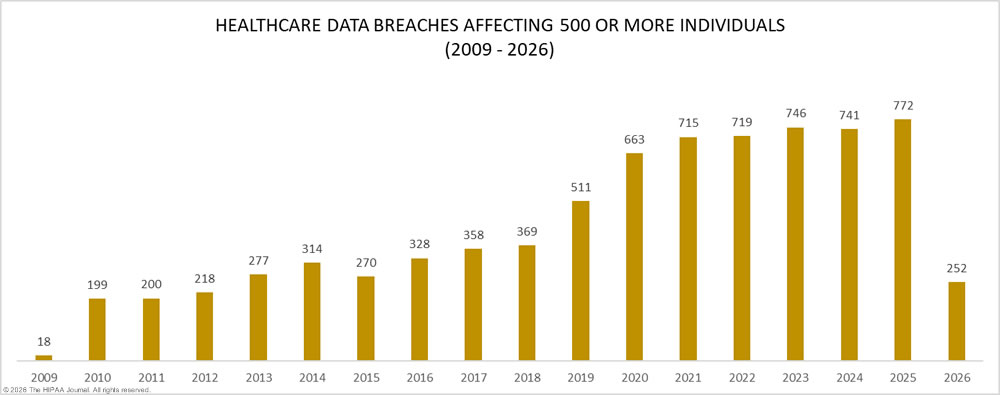
Our healthcare data breach statistics clearly show an upward trend in data breaches since 2009, when OCR first started publishing data breach summaries on its website, peaking in 2026, when 772 healthcare data breaches affecting 500 or more individuals were reported to OCR.
There was a sharp increase in data breaches between 2018 and 2021, with data breaches doubling in just three years as cybercriminals aggressively adopted ransomware and actively targeted the healthcare sector. The large annual increases in data breaches came to an end in 2021, increasing by around 4% between 2022 and 2023, and again by around 4% from 2024 to 2025, when a new annual record was set with 772 large data breaches reported.
It is too early in the year to draw any conclusions about whether healthcare data breaches will increase, decrease, or remain at a similar level this year. Based on the current data from the OCR data breach portal, from January 1, 2026, to April 30, 2026, 252 large healthcare data breaches have been reported to OCR, 9.5% fewer data breaches than the corresponding period in 2025.
It should be noted that OCR has been slow to publish data on its data breach portal this year, most likely due to a hangover from the longest-ever government shutdown in late 2025. The HHS all but shut down for 43 days from October 1 to November 12, 2025, due to the failure of Congress to pass an appropriations bill, during which time data breaches stopped being added to the OCR breach portal. Additions to the portal have been slow since. For instance, in the month of March 2026, 3 months after staff returned to work at the HHS following the shutdown, no data breaches were added to the portal for that month. As of June 2026, data breaches are still being added to the breach portal for March 2026.
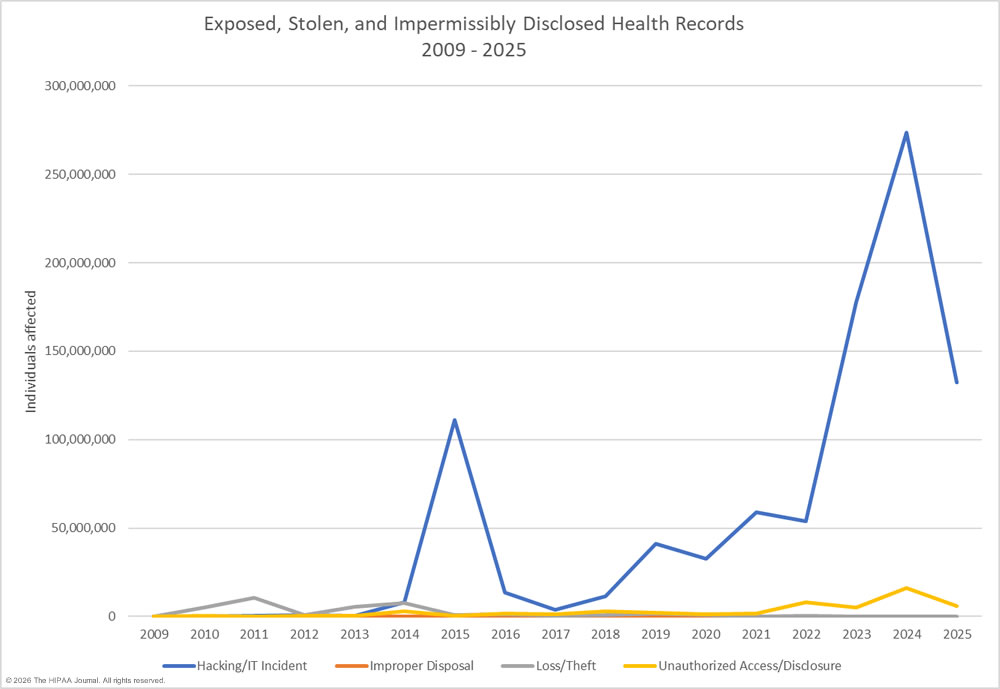
It stands to reason that as data breach numbers increase, the number of affected individuals rises, but the increase has been considerable due to an increase in very large healthcare data breaches. Between 2020 and 2021, data breaches increased by 7.8%; however, the number of affected individuals increased by 73% over that period. The number of data breaches and affected individuals remained largely unchanged between 2021 and 2022, before another significant hike in breach victim count. Between 2022 and 2023, data breaches increased by around 3.8%, but the number of affected individuals increased by more than 193%. There was a 0.5% decline in reported large healthcare data breaches between 2023 and 2024, yet the number of affected individuals soared by 58% to more than 289 million individuals in a single year, which is almost 85% of the population of the United States.
The huge rise in affected individuals in 2023 and 2024 was due to an increase in mega data breaches, incidents involving unauthorized access to the protected health information of more than 1 million individuals. The largest healthcare data breach of all time, beating the previous record of 78.8 million individuals set by Anthem Inc. in 2015, was set in 2024, when Change Healthcare, a healthcare clearinghouse, experienced the mother of all data breaches. An estimated 192.7 million individuals were affected by the Change Healthcare ransomware attack (more information).
In 2025, the mega data breaches continued, the largest of which occurred at the business associate Conduent Business Services. The review of the affected data has taken several months; however, the scale of the breach is now clear. The protected health information of more than 62 million Americans was compromised in the incident, making it the third-largest healthcare data breach of all time. Mega data breaches were also announced in 2025 by Aflac, which affected almost 14 million individuals – the 5th largest healthcare data breach of all time, and Episource, which affected more than 6.7 million individuals.
HIPAA requires all healthcare data breaches to be reported to OCR, regardless of their size; however, OCR is only required to publish details of data breaches affecting 500 or more individuals. The healthcare data breach statistics in this article have been calculated using data obtained from OCR for data breaches affecting 500 or more individuals. The breaches included in the statistics and graphs below include closed cases and breaches that are still under or awaiting investigation by OCR for potential HIPAA violations.
OCR does provide some insight into the volume and nature of the tens of thousands of small data breaches that are reported each year through its HITECH Act-mandated reports to Congress. While smaller breaches do include some hacking incidents, the majority of small data breaches are unauthorized access and disclosure incidents, such as accidentally faxing, emailing, or mailing the PHI of one individual to an incorrect individual. The latest report to Congress for calendar year 2024 shows a 12% increase in small data breaches from 2020 to 2024.
| Year | Data Breaches Affecting Fewer Than 500 Individuals | Percentage Annual Change |
| 2024 | 74,299 | 9% increase |
| 2023 | 68,315 | 7% increase |
| 2022 | 63,966 | 15% increase |
| 2021 | 63,571 | 4% decrease |
| 2020 | 66,509 | 6% increase |
| 2020 to 2024 | – | 12% increase |
 Between October 21, 2009, when OCR first started publishing summaries of data breach reports on its “Wall of Shame”, and April 30, 2026, 7,670 large healthcare data breaches were reported to OCR. Currently, 936 data breaches are listed as under investigation or awaiting investigation. In 2024, when we compiled the data, there were 882 data breach investigations that had either not been started or not been closed, so the backlog is growing.
OCR has to investigate all large healthcare data breaches, and its workload has grown considerably due to the constantly increasing number of data breaches; however, its budget has remained flat. OCR has made some changes to its structure to get better use of its resources, and investigations of data breaches have become more focused, but even these changes are doing little to make significant inroads into the backlog of investigations. To do that, OCR will need Congress to approve additional funding.
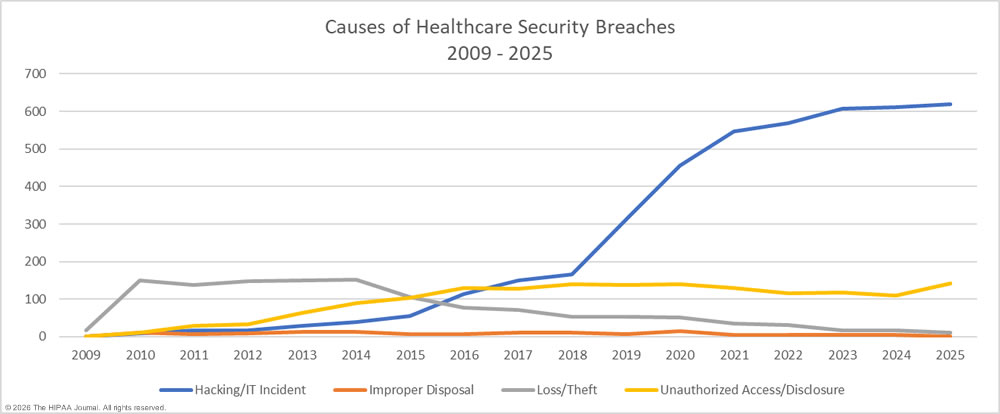
There have been notable changes over the years in the main causes of breaches. The loss and theft of healthcare records and electronic protected health information dominated the breach reports between 2009 and 2015. The move to digital recordkeeping, more accurate tracking of electronic devices, widespread adoption of data encryption, and use of the cloud for data storage have been key in reducing these data breaches. Loss and theft incidents are now rarely reported.
There has also been a downward trend in improper disposal incidents and unauthorized access/disclosure incidents, although the latter increased in 2025. While these types of data breaches are decreasing, hacking and other IT incidents have soared. In 2023, OCR reported a 239% increase in hacking-related data breaches between January 1, 2018, and September 30, 2023, and a 278% increase in ransomware attacks over the same period. In 2019, hacking accounted for 49% of all reported breaches. In 2023, 79.7% of data breaches were due to hacking incidents. While OCR has not published data on the percentage of data breaches in 2025 due to hacking, the data breach portal shows that hacking and other IT incidents combined accounted for more than 80% of large healthcare data breaches.
This article is updated annually; however, the graphs and tables are updated more frequently, typically around the 21st of each month, although there has been a lag in 2026 due to the slow publication of breach data by OCR. Please bookmark or link to this page and check back regularly to see the emerging trends for the current year.
The Biggest U.S. Healthcare Data Breaches of All Time (2009 – 2026)
The unenviable record for the largest healthcare data breach was held by Anthem Inc. for several years. The data breach was reported in 2015 and involved the theft of an astonishing volume of patient data. The data breach affected 78.8 million individuals, smashing the previous record of 6.1 million individuals set the previous year. In 2025, two other huge data breaches were reported by health plans – a 9.4 million-record data breach at Excellus Health Plan, and an 11.27 million-record breach at Premera Blue Cross.
While the Anthem data breach was a wake-up call to the healthcare industry and prompted the implementation of data segmentation and data retention changes, it was only a matter of time before that record was broken. That record was smashed in 2024 when a ransomware group breached the network of the healthcare clearinghouse Change Healthcare and stole an astonishing volume of data – 192.7 million individuals are known to have been affected and had their personal and health information stolen in that single attack. You can read more about this devastating cyberattack in this article.
The table below shows the biggest confirmed healthcare data breaches of all time, and includes the number of individuals currently known to have been affected. The numbers are subject to change as investigations progress and new compromised data is identified.
| Regulated Entity | State | Covered Entity Type | Individuals Affected | Breach Submission Date | Type of Breach | |
| 1 | Change Healthcare, Inc. | MN | Business Associate | 192,700,000 | 2024 | Hacking/IT Incident |
| 2 | Anthem Inc. | IN | Health Plan | 78,800,000 | 2015 | Hacking/IT Incident |
| 3 | Conduent Business Services LLC | NJ | Business Associate | 62,224,658 | 2025 | Hacking/IT Incident |
| 4 | Welltok, Inc. | CO | Business Associate | 14,782,887 | 2023 | Hacking/IT Incident |
| 5 | Aflac Incorporated (“Aflac”) | GA | Health Plan | 13,924,906 | 2025 | Hacking/IT Incident |
| 6 | Kaiser Foundation Health Plan, Inc. | CA | Health Plan | 13,400,000 | 2024 | Unauthorized Access/Disclosure |
| 7 | Optum360, LLC | MN | Business Associate | 11,500,000 | 2019 | Hacking/IT Incident |
| 8 | HCA Healthcare | TN | Business Associate | 11,270,000 | 2023 | Hacking/IT Incident |
| 9 | Premera Blue Cross | WA | Health Plan | 11,000,000 | 2015 | Hacking/IT Incident |
| 10 | Laboratory Corporation of America Holdings dba LabCorp | NC | Healthcare Provider | 10,251,784 | 2019 | Hacking/IT Incident |
| 11 | Excellus Health Plan, Inc. | NY | Health Plan | 9,358,891 | 2015 | Hacking/IT Incident |
| 12 | Perry Johnson & Associates, Inc. dba PJ&A | NV | Business Associate | 9,302,588 | 2023 | Hacking/IT Incident |
| 13 | Maximus, Inc. | VA | Business Associate | 9,179,390 | 2023 | Hacking/IT Incident |
| 14 | Managed Care of North America | GA | Business Associate | 8,627,242 | 2023 | Hacking/IT Incident |
| 15 | Delta Dental of California | CA | Health Plan | 7,056,189 | 2023 | Hacking/IT Incident |
| 16 | Episource, LLC | CA | Business Associate | 6,725,572 | 2025 | Hacking/IT Incident |
| 17 | Community Health Systems Professional Services Corporations | TN | Healthcare Provider | 6,121,158 | 2014 | Hacking/IT Incident |
| 18 | PharMerica Corporation | KY | Healthcare Provider | 5,815,591 | 2023 | Hacking/IT Incident |
| 19 | Yale New Haven Health System | CT | Healthcare Provider | 5,556,702 | 2025 | Hacking/IT Incident |
| 20 | Ascension Health | MO | Healthcare Provider | 5,466,931 | 2024 | Hacking/IT Incident |
| 21 | Science Applications International Corporation (SA | VA | Business Associate | 4,900,000 | 2011 | Loss |
| 22 | HealthEC LLC | NJ | Business Associate | 4,786,241 | 2023 | Hacking/IT Incident |
| 23 | Blue Shield of California | CA | Business Associate | 4,700,000 | 2025 | Unauthorized Access/Disclosure |
| 24 | University of California, Los Angeles Health | CA | Healthcare Provider | 4,500,000 | 2015 | Hacking/IT Incident |
| 25 | Community Health Systems Professional Services Corporation | TN | Business Associate | 4,500,000 | 2014 | Theft |
| 26 | HealthEquity, Inc. | UT | Business Associate | 4,300,000 | 2024 | Hacking/IT Incident |
| 27 | Independent Living Systems, LLC | FL | Business Associate | 4,226,508 | 2022 | Hacking/IT Incident |
| 28 | Reventics, LLC | FL | Business Associate | 4,212,823 | 2023 | Hacking/IT Incident |
| 29 | 20/20 Eye Care Network, Inc | FL | Business Associate | 4,142,440 | 2021 | Hacking/IT Incident |
| 30 | OneTouchPoint, Inc. | WI | Business Associate | 4,112,892 | 2022 | Hacking/IT Incident |
| 31 | Colorado Department of Health Care Policy & Financing | CO | Health Plan | 4,091,794 | 2023 | Hacking/IT Incident |
| 32 | Advocate Health and Hospitals Corporation, d/b/a Advocate Medical Group | IL | Healthcare Provider | 4,029,530 | 2013 | Theft |
| 33 | Concentra Health Services, Inc. | TX | Healthcare Provider | 3,998,163 | 2024 | Hacking/IT Incident |
| 34 | Banner Health | AZ | Healthcare Provider | 3,620,000 | 2016 | Hacking/IT Incident |
| 35 | Florida Healthy Kids Corporation | FL | Health Plan | 3,500,000 | 2021 | Hacking/IT Incident |
| 36 | Medical Informatics Engineering | IN | Business Associate | 3,500,000 | 2015 | Hacking/IT Incident |
| 37 | Newkirk Products, Inc. | NY | Business Associate | 3,466,120 | 2016 | Hacking/IT Incident |
| 38 | TriZetto Provider Solutions | MO | Business Associate | 3,433,965 | 2026 | Hacking/IT Incident |
| 39 | Regal Medical Group,Lakeside Medical Organization, ADOC Acquisition, & Greater Covina Medical Group | CA | Healthcare Provider | 3,388,856 | 2023 | Hacking/IT Incident |
| 40 | Trinity Health | MI | Business Associate | 3,320,726 | 2020 | Hacking/IT Incident |
| 41 | CareSource | OH | Business Associate | 3,180,537 | 2023 | Hacking/IT Incident |
| 42 | Cerebral, Inc | DE | Business Associate | 3,179,835 | 2023 | Unauthorized Access/Disclosure |
| 43 | QualDerm Partners, LLC | TN | Healthcare Provider | 3,117,874 | 2026 | Hacking/IT Incident |
| 44 | Centers for Medicare & Medicaid Services | MD | Health Plan | 3,112,815 | 2024 | Hacking/IT Incident |
| 45 | NationsBenefits Holdings, LLC | FL | Business Associate | 3,099,502 | 2023 | Hacking/IT Incident |
| 46 | Advocate Aurora Health | WI | Healthcare Provider | 3,000,000 | 2022 | Unauthorized Access/Disclosure |
| 47 | Dominion Dental Services, Inc., Dominion National Insurance Company, and Dominion Dental Services USA, Inc. | VA | Health Plan | 2,964,778 | 2019 | Hacking/IT Incident |
| 48 | PIH Health, Inc. | CA | Healthcare Provider | 2,947,264 | 2025 | Hacking/IT Incident |
| 49 | Lincare Holdings Inc. | FL | Healthcare Provider | 2,918,444 | 2021 | Hacking/IT Incident |
| 50 | Acadian Ambulance Service, Inc. | LA | Healthcare Provider | 2,896,985 | 2024 | Hacking/IT Incident |
| 51 | Connexin Software, Inc. | PA | Business Associate | 2,846,039 | 2022 | Hacking/IT Incident |
| 52 | Navvis & Company, LLC | MO | Business Associate | 2,824,726 | 2023 | Hacking/IT Incident |
| 53 | A&A Services d/b/a Sav-Rx | NE | Business Associate | 2,812,336 | 2024 | Hacking/IT Incident |
| 54 | ESO Solutions, Inc. | TX | Business Associate | 2,700,000 | 2023 | Hacking/IT Incident |
| 55 | DaVita Inc. | CO | Healthcare Provider | 2,689,826 | 2025 | Hacking/IT Incident |
| 56 | Veradigm LLC | IL | Business Associate | 2,672,036 | 2025 | Hacking/IT Incident |
| 57 | Harvard Pilgrim Health Care | MA | Health Plan | 2,662,337 | 2023 | Hacking/IT Incident |
| 58 | AccuDoc Solutions, Inc. | NC | Business Associate | 2,652,537 | 2018 | Hacking/IT Incident |
| 59 | NEC Networks, LLC d/b/a CaptureRx | TX | Business Associate | 2,600,000 | 2021 | Hacking/IT Incident |
| 60 | Smile Brands, Inc. | CA | Business Associate | 2,592,494 | 2021 | Hacking/IT Incident |
| 61 | WebTPA Employer Services, LLC (“WebTPA”) | TX | Business Associate | 2,518,533 | 2024 | Hacking/IT Incident |
| 62 | Nacogdoches Memorial Hospital n | TX | Healthcare Provider | 2,507,073 | 2026 | Hacking/IT Incident |
| 63 | Norton Healthcare Inc. | KY | Healthcare Provider | 2,500,000 | 2023 | Hacking/IT Incident |
| 64 | Enzo Clinical Labs, Inc. | NY | Healthcare Provider | 2,470,000 | 2023 | Hacking/IT Incident |
| 65 | Florida Health Sciences Center, Inc. dba Tampa General Hospital | FL | Healthcare Provider | 2,430,920 | 2023 | Hacking/IT Incident |
| 66 | Forefront Dermatology, S.C. | WI | Healthcare Provider | 2,413,553 | 2021 | Hacking/IT Incident |
| 67 | INTEGRIS Health | OK | Healthcare Provider | 2,385,646 | 2024 | Hacking/IT Incident |
| 68 | Shields Health Care Group, Inc. | MA | Business Associate | 2,380,483 | 2022 | Hacking/IT Incident |
| 69 | Postmeds, Inc. | CA | Healthcare Provider | 2,369,026 | 2023 | Hacking/IT Incident |
| 70 | Centers for Medicare & Medicaid Services | MD | Health Plan | 2,342,357 | 2023 | Hacking/IT Incident |
| 71 | Medical Management Resource Group, L.L.C. | AZ | Business Associate | 2,264,157 | 2024 | Hacking/IT Incident |
| 72 | 21st Century Oncology | FL | Healthcare Provider | 2,213,597 | 2016 | Hacking/IT Incident |
| 73 | Navia Benefit Solutions, Inc. | WA | Business Associate | 2,151,330 | 2026 | Hacking/IT Incident |
| 74 | McLaren Health Care | MI | Healthcare Provider | 2,103,881 | 2023 | Hacking/IT Incident |
| 75 | Berry, Dunn, McNeil & Parker, LLC | ME | Business Associate | 2,068,426 | 2023 | Hacking/IT Incident |
| 76 | Xerox State Healthcare, LLC | TX | Business Associate | 2,000,000 | 2014 | Unauthorized Access/Disclosure |
| 77 | Arietis Health, LLC | FL | Business Associate | 1,975,066 | 2023 | Hacking/IT Incident |
| 78 | Great Expressions Dental Centers | MI | Healthcare Provider | 1,925,397 | 2023 | Hacking/IT Incident |
| 79 | Professional Finance Company, Inc. | CO | Business Associate | 1,918,941 | 2022 | Hacking/IT Incident |
| 80 | Anne Arundel Dermatology | MD | Healthcare Provider | 1,905,000 | 2025 | Hacking/IT Incident |
| 81 | IBM | NY | Business Associate | 1,900,000 | 2011 | Unknown |
| 82 | Apria Healthcare LLC | IN | Healthcare Provider | 1,868,831 | 2022 | Hacking/IT Incident |
| 83 | Pension Benefit Information, LLC | MN | Business Associate | 1,866,694 | 2023 | Hacking/IT Incident |
| 84 | Fred Hutchinson Cancer Center | WA | Healthcare Provider | 1,840,927 | 2023 | Hacking/IT Incident |
| 85 | Summit Pathology and Summit Pathology Laboratories, Inc. | CO | Healthcare Provider | 1,813,538 | 2024 | Hacking/IT Incident |
| 86 | New York City Health and Hospitals Corporation | NY | Healthcare Provider | 1,800,000 | 2026 | Hacking/IT Incident |
| 87 | Performance Health Technology | OR | Business Associate | 1,752,076 | 2023 | Hacking/IT Incident |
| 88 | NASCO | GA | Business Associate | 1,744,655 | 2023 | Hacking/IT Incident |
| 89 | OnePoint Patient Care | AZ | Healthcare Provider | 1,741,152 | 2024 | Hacking/IT Incident |
| 90 | Clinical Pathology Laboratories, Inc. | TX | Healthcare Provider | 1,733,836 | 2019 | Hacking/IT Incident |
| 91 | Dental Care Alliance, LLC | FL | Business Associate | 1,723,375 | 2020 | Hacking/IT Incident |
| 92 | GRM Information Management Services | NJ | Business Associate | 1,700,000 | 2011 | Theft |
| 93 | Kettering Adventist Healthcare | OH | Healthcare Provider | 1,695,382 | 2025 | Hacking/IT Incident |
| 94 | Keenan & Associates | CA | Health Plan | 1,651,124 | 2023 | Hacking/IT Incident |
| 95 | Baptist Medical Center | TX | Healthcare Provider | 1,608,549 | 2022 | Hacking/IT Incident |
| 96 | Inmediata Health Group | PR | Healthcare Clearing House | 1,565,338 | 2019 | Unauthorized Access/Disclosure |
| 97 | Eskenazi Health | IN | Healthcare Provider | 1,515,918 | 2021 | Hacking/IT Incident |
| 98 | Community Health Network, Inc. as an Affiliated Covered Entity | IN | Healthcare Provider | 1,500,000 | 2022 | Unauthorized Access/Disclosure |
Healthcare Data Breaches by Year
Between 2009 and 2025, 7,418 healthcare data breaches affecting 500 or more individuals were reported to OCR. Those breaches have resulted in the exposure or impermissible disclosure of the protected health information of more than one billion Americans – 1,013,066,481 to be precise – which is more than 2.9 times the current population of the United States. If you have ever received any healthcare services or bought health insurance, your data is likely to have been breached, and quite possibly multiple times.
In 2018, healthcare data breaches affecting 500 or more individuals were being reported at a rate of around 1 per day. Fast forward to 2023 and 2024, and the rate more than doubled to a rate of more than 2 breaches a day. In 2025, large healthcare data breaches were reported at an average rate of 2.1 data breaches per day.
In 2024, an average of 792,226 individuals were affected by a healthcare data breach every day. The huge total was due to a mega data breach at Change Healthcare that affected 192.7 million individuals. In 2025, the total number of affected individuals fell; however, only to around 138.5 million. In 2025, on average, 379,306 individuals had their personal and protected health information breached each day.
Healthcare Records Exposed by Year
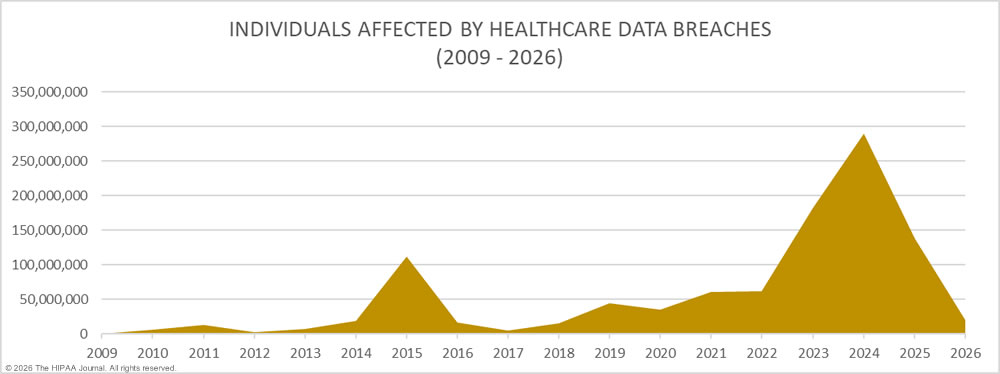
There has been a general upward trend in the number of individuals affected by healthcare data breaches each year, with a massive increase in 2015. Until 2023, 2015 was the worst year in history for breached healthcare records, with more than 112 million records exposed or impermissibly disclosed. 2015 was particularly bad due to three massive data breaches at health plans: Anthem Inc., Premera Blue Cross, and Excellus. The Anthem breach affected 78.8 million of its members, with the Premera Blue Cross affecting 11.27 million individuals, and the Excellus data breaches affecting 9.35 million individuals. Those data breaches are small in comparison to the data breach at Change Healthcare in 2024, which affected an estimated 192.7 million individuals. The second-largest data breach of 2024 was reported by Kaiser Foundation Health Plan and affected 13.4 million individuals. In 2025, the top two healthcare data breaches were reported by Conduent Business Services, which affected 62.2 million individuals – the third largest healthcare data breach of all time, followed by Aflac Incorporated, which affected 13.9 million individuals.
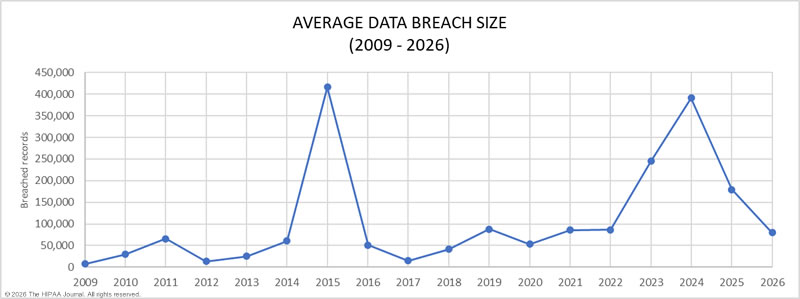
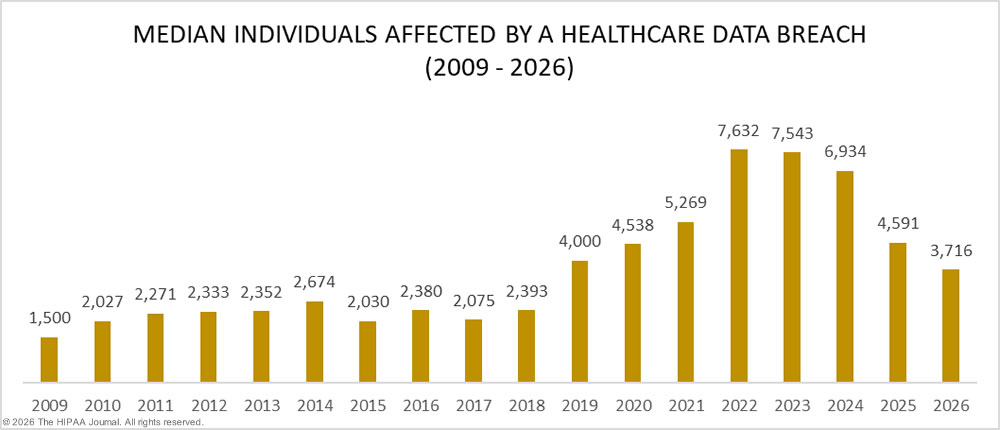
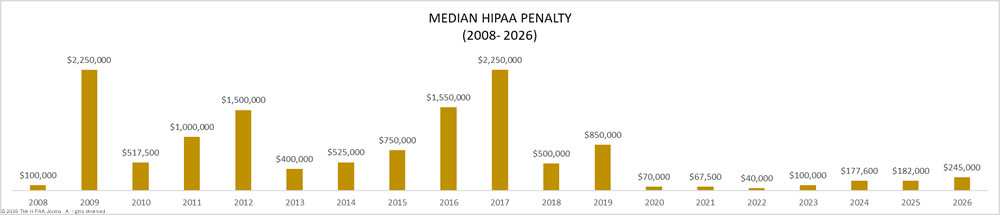
Average/Median Healthcare Data Breach Size by Year
Get The FREE
HIPAA Compliance Checklist
Immediate Delivery of Checklist Link To Your Email Address
Please enter correct email address
Your Privacy Respected
HIPAA Journal Privacy Policy

Causes of Healthcare Data Breaches
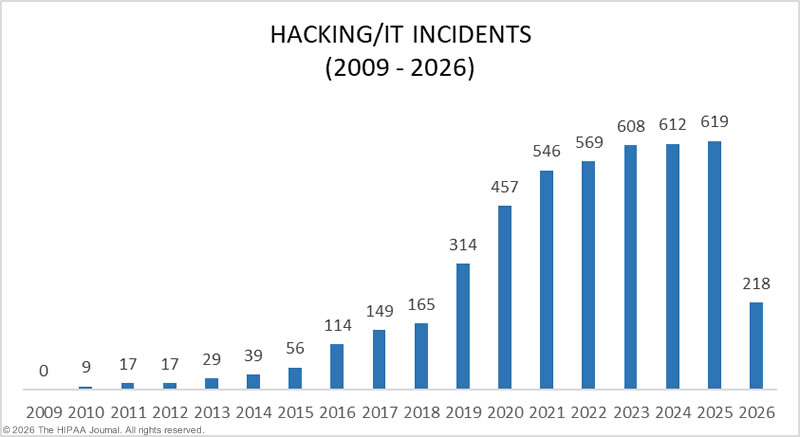
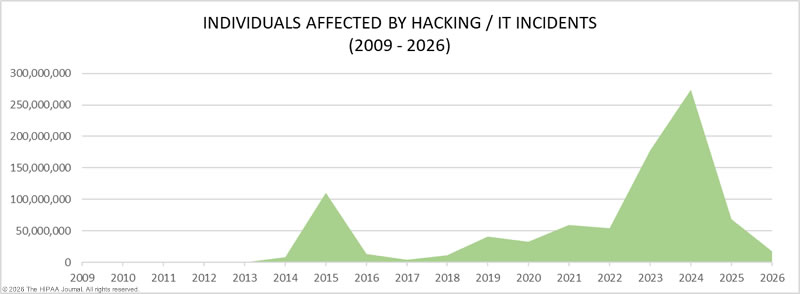
Healthcare Hacking Incidents by Year
Our healthcare data breach statistics show that hacking is now the leading cause of healthcare data breaches, although it should be noted that healthcare organizations are now much better at detecting hacking incidents than they were in 2010. The low number of hacking/IT incidents in the earlier years could be partially due to the failure to detect hacking incidents and malware infections, although it is clear that there has been a massive increase in attacks in recent years. Many of the hacking incidents between 2014 and 2018 occurred many months – and in some cases, years – before they were detected. While the OCR data does not distinguish between hacking and other IT incidents, OCR has confirmed that 79.7% of breaches in 2023 were the result of hacking, and between 2018 and 2023, there was a 278% increase in ransomware attacks. While hacking incidents do not appear to be in decline, they have at least stopped increasing at such a high rate.
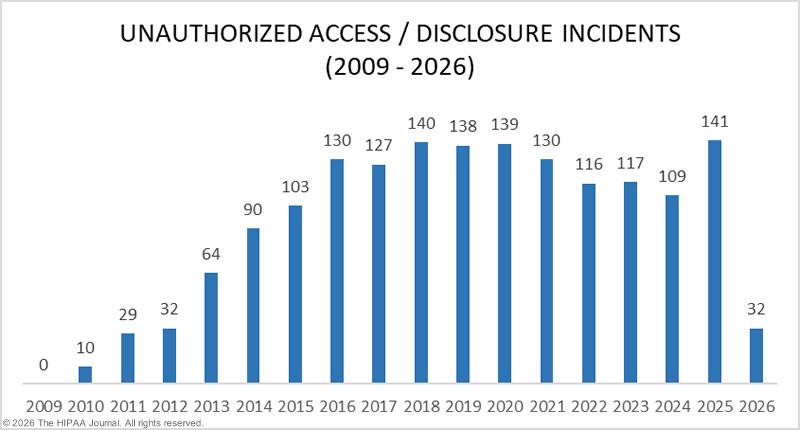
Unauthorized Access/Disclosures by Year
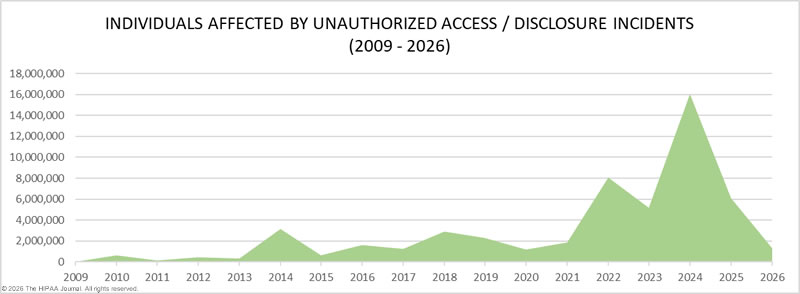
As with hacking, healthcare organizations are getting better at detecting insider breaches. Behavioral detection systems can identify unauthorized access by insiders, such as when employees access medical records when there is no legitimate work purpose for doing so. These incidents include employee errors, negligence, snooping on medical records, and data theft by malicious insiders, and as the second chart below shows, the severity of these breaches has increased significantly in recent years.
One of the reasons for this is the use of website tracking and analytics technologies. These tools have been added to healthcare websites and even patient portals, and track user behavior. The collected data is often sent to the third-party providers of the tools. If protected health information is collected, and there is no business associate agreement with the third-party provider of the tools, it is a reportable data breach.
Unauthorized disclosure incidents of this nature have been extensively reported in recent years, and they often affect millions of individuals. Better HIPAA training and security awareness training, along with the use of technologies for monitoring access to medical records, are helping to reduce unauthorized access and disclosure incidents, although there was an increase in unauthorized access/disclosure incidents in 2025.
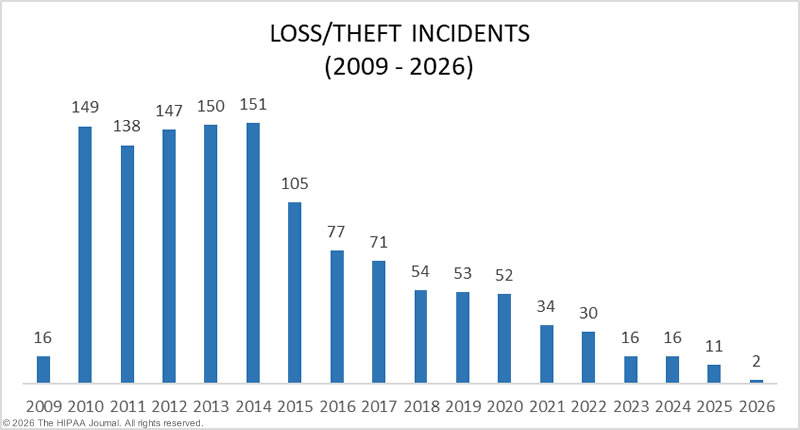
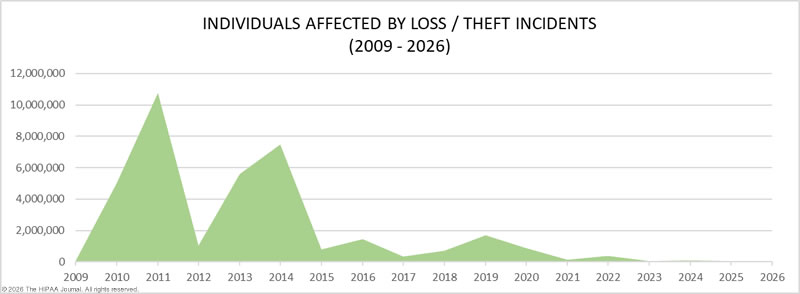
Loss/Theft of PHI and Unencrypted ePHI by Year
Our healthcare data breach statistics show that HIPAA-covered entities and business associates have got significantly better at protecting healthcare records with administrative, physical, and technical controls, such as encryption. If PHI on a device is encrypted and the device is stolen, there is no data breach unless the credentials to decrypt the data are also stolen. Further, data is now often stored in the cloud rather than on devices, which makes it easier to protect. While loss and theft incidents were once one of the most common types of healthcare data breaches, they have fallen to a level of less than one breach a month, and often involve paper records rather than lost or stolen electronic devices.
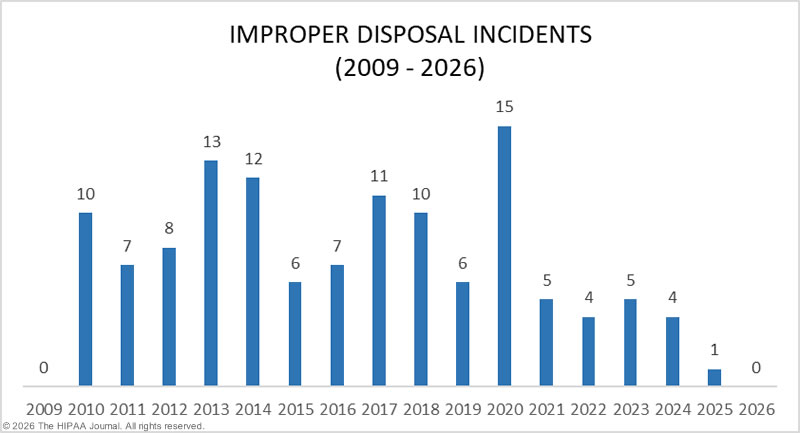
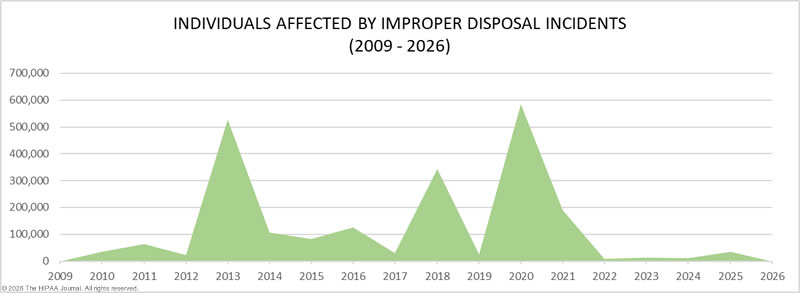
Improper Disposal of PHI/ePHI by Year
HIPAA requires healthcare data, whether in physical or electronic form, to be permanently destroyed when no longer required. The improper disposal of PHI is a relatively infrequent breach cause and typically involves paper records that have not been sent for shredding or have been abandoned. Better training of healthcare staff about the requirements of HIPAA has helped to keep these breaches to a minimum, along with the transition from paper to electronic records. In 2025, only one improper disposal incident was reported by a HIPAA-regulated entity.
Healthcare Data Breaches by HIPAA-Regulated Entity Type
The table below shows raw data from the OCR breach portal, based on the entity that reported the data breach.
Healthcare Data Breaches: Reporting Entity (2009 – 2026)
| Year | Healthcare Provider | Health Plan | Business Associate | Healthcare Clearinghouse | Total |
| 2009 | 14 | 1 | 3 | 0 | 18 |
| 2010 | 134 | 21 | 44 | 0 | 199 |
| 2011 | 135 | 19 | 45 | 1 | 200 |
| 2012 | 154 | 23 | 40 | 1 | 218 |
| 2013 | 191 | 20 | 64 | 2 | 277 |
| 2014 | 200 | 40 | 74 | 0 | 314 |
| 2015 | 195 | 61 | 14 | 0 | 270 |
| 2016 | 256 | 50 | 22 | 0 | 328 |
| 2017 | 285 | 52 | 21 | 0 | 358 |
| 2018 | 274 | 53 | 42 | 0 | 369 |
| 2019 | 396 | 59 | 54 | 2 | 511 |
| 2020 | 514 | 73 | 74 | 2 | 663 |
| 2021 | 516 | 104 | 93 | 2 | 715 |
| 2022 | 504 | 86 | 129 | 0 | 719 |
| 2023 | 469 | 103 | 172 | 2 | 746 |
| 2024 | 543 | 77 | 118 | 3 | 741 |
| 2025 | 575 | 59 | 136 | 2 | 772 |
| 2026 | 190 | 31 | 31 | 0 | 252 |
| Total | 5,545 | 932 | 1,176 | 17 | 7,670 |
The above figures are calculated based on the reporting entity. When a data breach occurs at a business associate, it may be reported by the business associate or by each affected HIPAA-covered entity. For instance, in 2022, the electronic health record provider Eye Care Leaders suffered a ransomware attack. Each covered entity reported the breach separately. The HIPAA Journal has tracked the breach reports, and at least 39 HIPAA-covered entities were affected, and the records of more than 3.09 million individuals were exposed. Similarly, a major data breach occurred at American Medical Collection Agency in 2019 that was reported by each covered entity, rather than AMCA. That breach affected more than 25 million individuals. Even when business associates of HIPAA-covered entities self-report the data breaches, some of their covered entity clients choose to report the breach themselves. As a result, business associate data breaches tend to be under-represented in analyses of healthcare data breaches.
The graphs below paint a more accurate picture of where healthcare data breaches occurred, rather than the entities that reported the data breaches. The graphs clearly show the extent to which business associate data breaches have increased in recent years. Since business associates often work with many different covered entities, when a data breach occurs at a business associate, it can involve huge volumes of patient records, as the data breach at Change Healthcare clearly demonstrated.
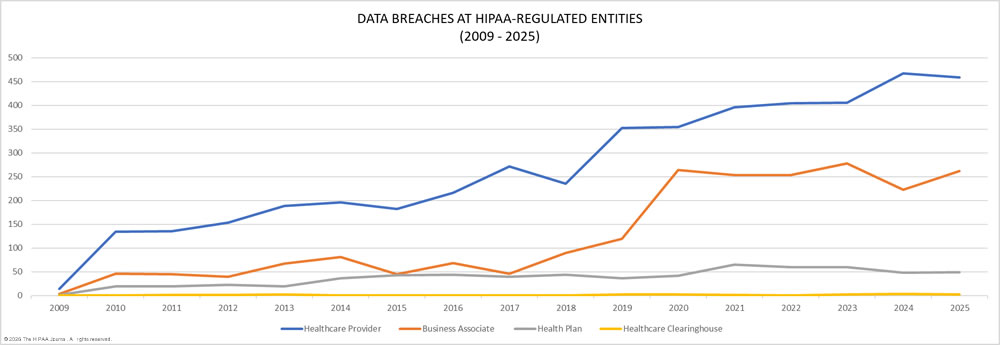
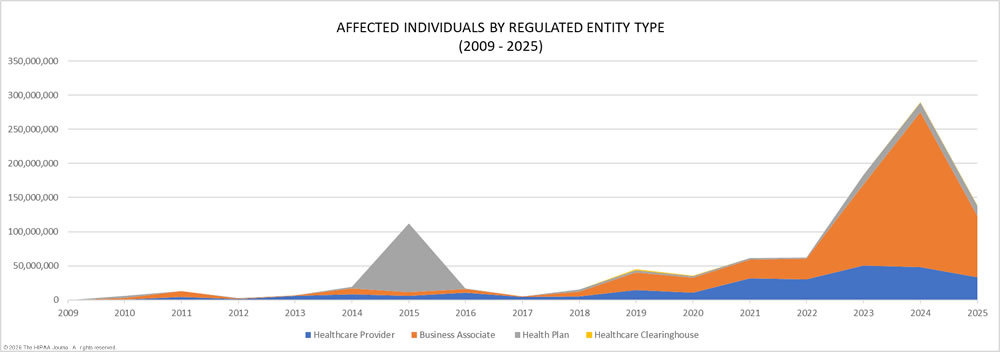
These data highlight the importance of securing the supply chain, conducting due diligence on vendors before their products and services are used, and monitoring existing vendors for HIPAA Security Rule compliance and cybersecurity. In 2026, one of the biggest challenges in healthcare cybersecurity is securing the supply chain.
OCR Settlements and Fines for HIPAA Violations
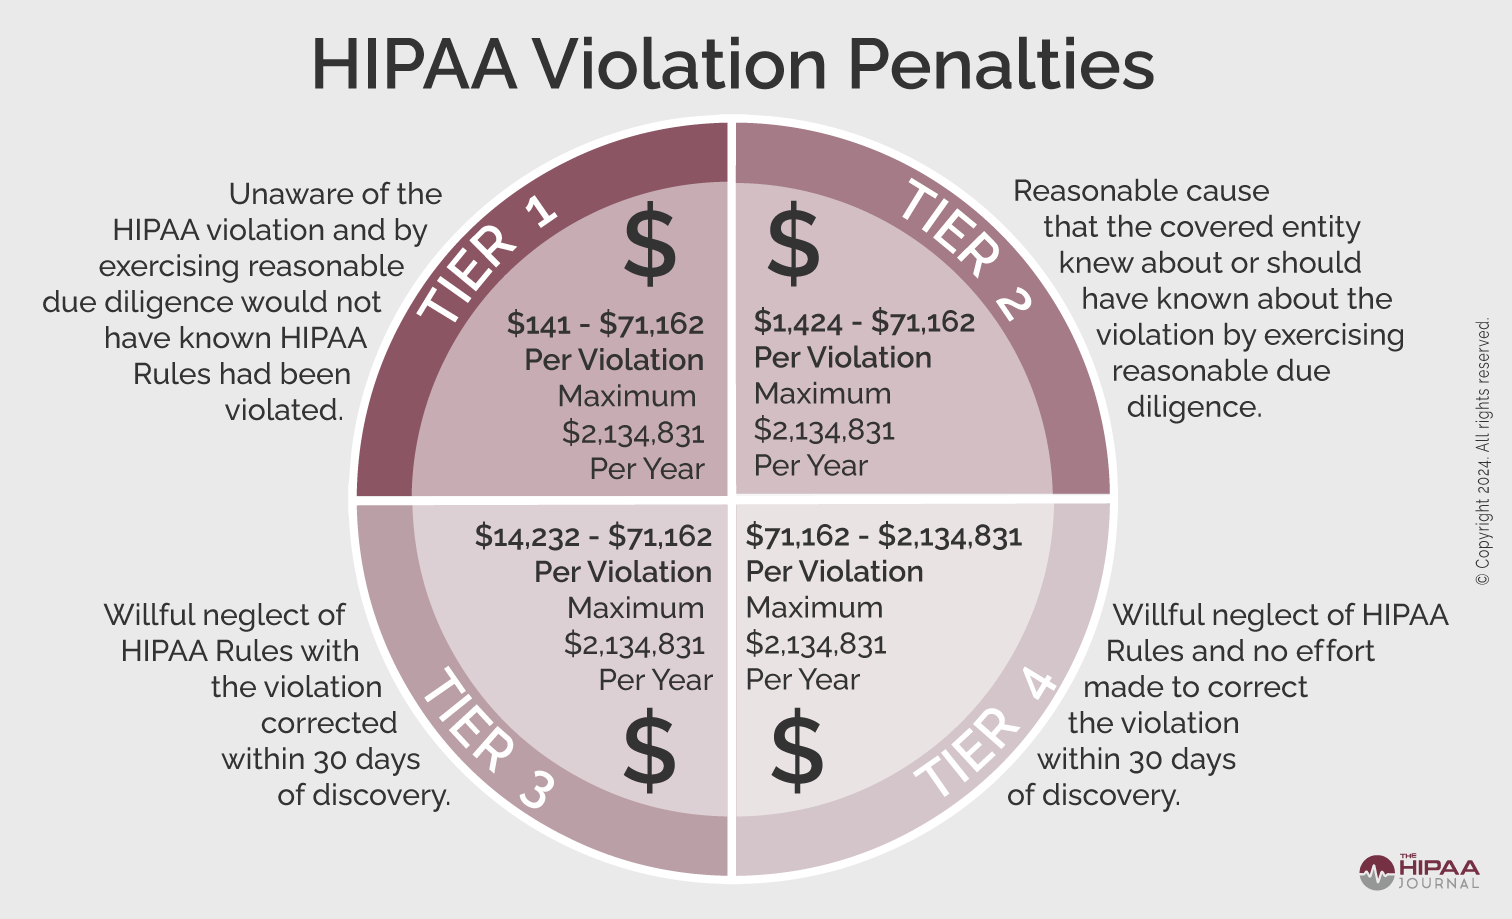
The penalties for HIPAA violations can be severe. Multi-million-dollar fines are possible when violations have been allowed to persist for several years or when there is systemic non-compliance with the HIPAA Rules, making HIPAA compliance financially as well as ethically important.
The penalty structure for HIPAA violations is detailed in the infographic below. These figures are adjusted annually for inflation. The current penalty amounts can be found here.
OCR Settlements and Fines Over the Years
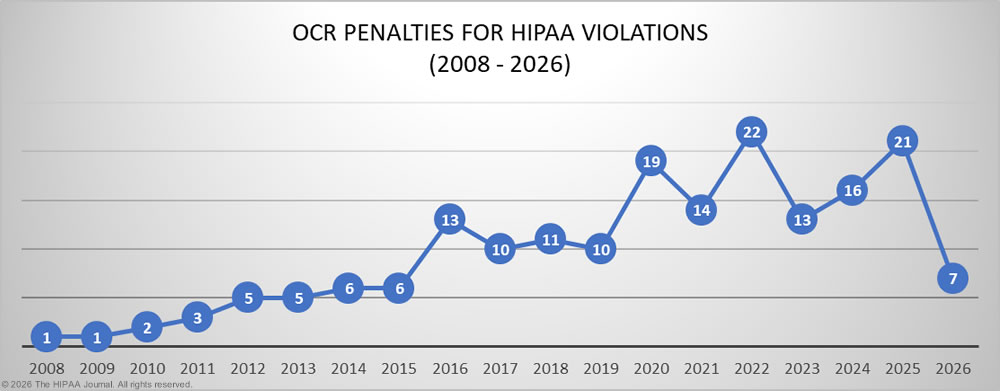
Further information on HIPAA fines and settlements can be viewed on our HIPAA violation cases page, which details all HIPAA violation fines imposed by OCR since 2008. As the graph below shows, HIPAA enforcement activity has steadily increased over the past 14 years, with 2022 being a record year, with 22 penalties imposed to resolve HIPAA violations
The major rise in HIPAA violation penalties in 2020 was largely due to a new enforcement initiative by OCR targeting non-compliance with the HIPAA Right of Access – the right of patients to access and obtain a copy of their healthcare data. 11 settlements were reached with healthcare providers in 2020 to resolve cases where patients were not given timely access to their medical records, and in 2021, all but two of the 14 penalties were for HIPAA Right of Access violations. From September 2019, when the initiative was launched, more than 50 penalties have been imposed by OCR to resolve HIPAA Right of Access violations.
There was a dip in HIPAA enforcement activity in 2023, but enforcement actions increased in 2024 and 2025. OCR investigates all breaches affecting 500 or more individuals and assesses whether they were due to noncompliance with the HIPAA Rules. OCR also investigates certain smaller breaches and complaints about potential HIPAA violations. Investigations take time, and while settlements can be negotiated relatively quickly, if the findings of an investigation are contested, it can take years for the HIPAA cases to be resolved.
OCR’s enforcement actions are limited by its budget, which has remained flat since 2009, only increasing in line with inflation. OCR’s workload has increased significantly, putting a strain on its resources. For instance, data breaches more than doubled between 2018 and 2021, yet OCR received no additional funding to support its investigations, other than the funds it collected from its enforcement actions. OCR has a large backlog of HIPAA cases to investigate, but it has been tackling this with more focused investigations. Investigations of hacking incidents are currently focused on the risk analysis provision of the HIPAA Security Rule, the most commonly identified HIPAA Security Rule violation. By focusing on this aspect of Security Rule compliance, OCR is able to complete investigations more quickly, helping to reduce the large backlog of data breach cases, while also holding HIPAA-regulated entities to account for risk analysis failures. As of January 31, 2026, OCR has closed 11 investigations of hacking incidents with financial penalties for HIPAA risk analysis failures under this enforcement initiative.
How Much Has OCR Fined HIPAA Covered Entities and Business Associates?
In addition to an increase in fines and settlements, penalty amounts increased considerably between 2015 and 2018. In 2018, the largest ever financial penalty for HIPAA violations was paid by Anthem Inc. to resolve potential violations of the HIPAA Security Rule that were discovered by OCR during the investigation of its 78.8 million record data breach in 2015. Anthem paid $16 million to settle the case. In 2020, Premera Blue Cross settled potential violations of the HIPAA Rules and paid a $6,850,000 penalty to resolve its 2015 data breach of the PHI of almost 10.5 million individuals, and in 2021, a $5,000,000 settlement was agreed upon with Excellus Health Plan to resolve HIPAA violations identified that contributed to its 2015 data breach of the PHI of almost 9.4 million individuals.
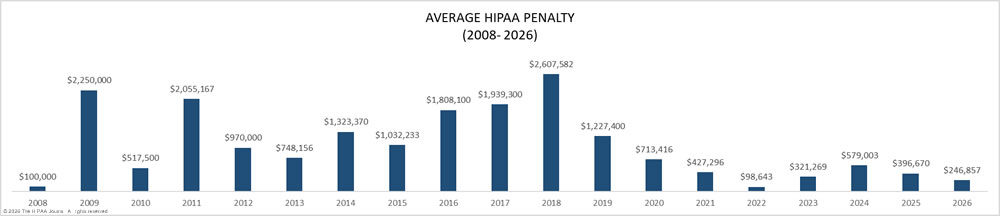
While large financial penalties are still imposed to resolve HIPAA violations, the trend has been for smaller penalties to be issued in recent years, with those penalties imposed on healthcare organizations of all sizes. It is no longer the case that smaller healthcare organizations escape HIPAA fines. In 2022, 55% of the financial penalties imposed by OCR were on small medical practices.
The fall in revenues from OCR’s enforcement activities in recent years is due to OCR reassessing the language of the HITECH Act, which called for penalties for HIPAA violations to be increased. OCR determined that the language of the HITECH Act had been misinterpreted at the time and reduced the penalty caps in three of the four penalty tiers. OCR is now petitioning Congress to increase the penalty caps to increase the deterrent effect of civil monetary penalties and encourage HIPAA-regulated entities to invest more resources into cybersecurity and HIPAA training.
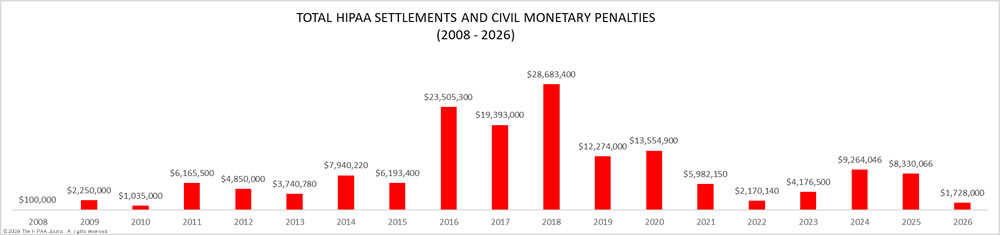
It was expected that 2018 would see fewer fines for HIPAA-covered entities than in the past two years due to HHS budget cuts, but that did not prove to be the case. 2018 was a record-breaking year for HIPAA fines and settlements, beating the previous record of $23,505,300 set in 2016 by 22%. OCR received payments totaling $28,683,400 in 2018 from HIPAA-covered entities and business associates who had violated HIPAA Rules, and 2020 saw a major increase in enforcement activity with 19 settlements. The number of financial penalties was reduced in 2021; however, 2022 saw penalties increase, with 22 financial penalties announced by OCR, more than in any other year to date. There was a reduction in enforcement actions in 2023, although there was an increase in penalty amounts. OCR had been concentrating on HIPAA Right of Access violations, for which the penalties are generally relatively low, as only one HIPAA provision is typically violated. In 2023, OCR imposed more fines for HIPAA Security Rule violations, where the entity concerned violated multiple aspects of the Security Rule, hence the higher penalties. In 2024, OCR closed 16 HIPAA investigations with financial penalties, and enforcement increased in 2025 with 21 penalties imposed.
In 2026, OCR will continue with its HIPAA Right of Access enforcement initiative, although fewer penalties are being imposed as HIPAA-covered entities have taken note of the penalties and are ensuring that they are fully compliant with this Privacy Rule provision. The risk analysis enforcement initiative will also be continuing, and the OCR Director has confirmed that this will evolve this year to also cover risk management. It should be noted that OCR issued multiple fines in 2025 for violations of the Breach Notification Rule.
OCR Penalties for HIPAA Violations (2008 – 2026)
| Year | Covered Entity | Amount | Penalty Type |
| 2026 | Spencer Gifts LLC Flexible Benefits and Welfare Benefit Plans | $450,000 | Settlement |
| 2026 | Assured Imaging Affiliated Covered Entities | $375,000 | Settlement |
| 2026 | Regional Women’s Health Group, dba Axia Women’s Health | $320,000 | Settlement |
| 2026 | Star Group, L.P. Health Benefits Plan | $245,000 | Settlement |
| 2026 | Consociate, Inc., dba Consociate Health | $225,000 | Settlement |
| 2026 | MMG Fusion | $10,000 | Settlement |
| 2026 | Top of the World Ranch Treatment Center | $103,000 | Settlement |
| 2025 | Concentra Inc. | $112,500 | Settlement |
| 2025 | Cadia Healthcare Facilities | $182,000 | Settlement |
| 2025 | BST & Co. CPAs, LLP | $175,000 | Settlement |
| 2025 | Syracuse ASC (Specialty Surgery Center of Central New York) | $250,000 | Settlement |
| 2025 | Deer Oaks – The Behavioral Health Solution | $225,000 | Settlement |
| 2025 | Comstar LLC | $75,000 | Settlement |
| 2025 | BayCare Health System | $800,000 | Settlement |
| 2025 | Vision Upright MRI | $5,000 | Settlement |
| 2025 | Comprehensive Neurology | $25,000 | Settlement |
| 2025 | PIH Health | $600,000 | Settlement |
| 2025 | Guam Memorial Hospital Authority | $25,000 | Settlement |
| 2025 | Northeast Radiology | $350,000 | Settlement |
| 2025 | Health Fitness Corporation | $227,816 | Settlement |
| 2025 | Oregon Health & Science University | $200,000 | Civil Monetary Penalty |
| 2025 | Warby Parker Inc. | $1,500,000 | Civil Monetary Penalty |
| 2025 | Northeast Surgical Group | $10,000 | Settlement |
| 2025 | South Broward Hospital District (Memorial Health System) | $60,000 | Settlement |
| 2025 | Solara Medical Supplies | $3,000,000 | Settlement |
| 2025 | USR Holdings | $337,750 | Settlement |
| 2025 | Virtual Private Network Solutions | $90,000 | Settlement |
| 2025 | Elgon Information Systems | $80,000 | Settlement |
| 2024 | Inmediata Health Group | $250,000 | Settlement |
| 2024 | Children’s Hospital Colorado Health System | $548,265 | Civil Monetary Penalty |
| 2024 | Gulf Coast Pain Consultants, dba Clearway Pain Solutions Institute | $1,190,000 | Civil Monetary Penalty |
| 2024 | Holy Redeemer Family Medicine | $35,581 | Settlement |
| 2024 | Rio Hondo Community Mental Health Center | $100,000 | Civil Monetary Penalty |
| 2024 | Bryan County Ambulance Authority | $90,000 | Settlement |
| 2024 | Plastic Surgery Associates of South Dakota | $500,000 | Settlement |
| 2024 | Gums Dental Care | $70,000 | Civil Monetary Penalty |
| 2024 | Providence Medical Institute | $240,000 | Civil Monetary Penalty |
| 2024 | Cascade Eye and Skin Centers | $250,000 | Settlement |
| 2024 | American Medical Response | $115,200 | Civil Monetary Penalty |
| 2024 | Heritage Valley Health System | $950,000 | Settlement |
| 2024 | Essex Residential Care (Hackensack Meridian Health, West Caldwell Care Center) | $100,000 | Civil Monetary Penalty |
| 2024 | Phoenix Healthcare | $35,000 | Settlement |
| 2024 | Green Ridge Behavioral Health | $40,000 | Settlement |
| 2024 | Montefiore Medical Center | $4,750,000 | Settlement |
| 2023 | Optum Medical Care of New Jersey | $160,000 | Settlement |
| 2023 | Lafourche Medical Group | $480,000 | Settlement |
| 2023 | St. Joseph’s Medical Center | $80,000 | Settlement |
| 2023 | Doctors’ Management Services | $100,000 | Settlement |
| 2023 | L.A. Care Health Plan | $1,300,000 | Settlement |
| 2023 | UnitedHealthcare | $80,000 | Settlement |
| 2023 | iHealth Solutions (dba Advantum Health) | $75,000 | Settlement |
| 2023 | Yakima Valley Memorial Hospital | $240,000 | Settlement |
| 2023 | Manasa Health Center, LLC | $30,000 | Settlement |
| 2023 | MedEvolve Inc. | $350,000 | Settlement |
| 2023 | David Mente, MA, LPC | $15,000 | Settlement |
| 2023 | Banner Health | $1,250,000 | Settlement |
| 2023 | Life Hope Labs, LLC | $16,500 | Settlement |
| 2022 | Health Specialists of Central Florida Inc | $20,000 | Settlement |
| 2022 | New Vision Dental | $23,000 | Settlement |
| 2022 | Great Expressions Dental Center of Georgia, P.C. | $80,000 | Settlement |
| 2022 | Family Dental Care, P.C. | $30,000 | Settlement |
| 2022 | B. Steven L. Hardy, D.D.S., LTD, dba Paradise Family Dental | $25,000 | Settlement |
| 2022 | New England Dermatology and Laser Center | $300,640 | Settlement |
| 2022 | ACPM Podiatry | $100,000 | Civil Monetary Penalty |
| 2022 | Memorial Hermann Health System | $240,000 | Settlement |
| 2022 | Southwest Surgical Associates | $65,000 | Settlement |
| 2022 | Hillcrest Nursing and Rehabilitation | $55,000 | Settlement |
| 2022 | MelroseWakefield Healthcare | $55,000 | Settlement |
| 2022 | Erie County Medical Center Corporation | $50,000 | Settlement |
| 2022 | Fallbrook Family Health Center | $30,000 | Settlement |
| 2022 | Associated Retina Specialists | $22,500 | Settlement |
| 2022 | Coastal Ear, Nose, and Throat | $20,000 | Settlement |
| 2022 | Lawrence Bell, Jr. D.D.S | $5,000 | Settlement |
| 2022 | Danbury Psychiatric Consultants | $3,500 | Settlement |
| 2022 | Oklahoma State University – Center for Health Sciences | $875,000 | Settlement |
| 2022 | Dr. Brockley | $30,000 | Settlement |
| 2022 | Jacob & Associates | $28,000 | Settlement |
| 2022 | Dr. U. Phillip Igbinadolor, D.M.D. & Associates, P.A. | $50,000 | Civil Monetary Penalty |
| 2022 | Northcutt Dental-Fairhope | $62,500 | Settlement |
| 2021 | Advanced Spine & Pain Management | $32,150 | Settlement |
| 2021 | Denver Retina Center | $30,000 | Settlement |
| 2021 | Dr. Robert Glaser | $100,000 | Civil Monetary Penalty |
| 2021 | Rainrock Treatment Center LLC (dba monte Nido Rainrock) | $160,000 | Settlement |
| 2021 | Wake Health Medical Group | $10,000 | Settlement |
| 2021 | Children’s Hospital & Medical Center | $80,000 | Settlement |
| 2021 | The Diabetes, Endocrinology & Lipidology Center, Inc. | $5,000 | Settlement |
| 2021 | AEON Clinical Laboratories (Peachstate) | $25,000 | Settlement |
| 2021 | Village Plastic Surgery | $30,000 | Settlement |
| 2021 | Arbour Hospital | $65,000 | Settlement |
| 2021 | Sharpe Healthcare | $70,000 | Settlement |
| 2021 | Renown Health | $75,000 | Settlement |
| 2021 | Excellus Health Plan | $5,100,000 | Settlement |
| 2021 | Banner Health | $200,000 | Settlement |
| 2020 | Peter Wrobel, M.D., P.C., dba Elite Primary Care | $36,000 | Settlement |
| 2020 | University of Cincinnati Medical Center | $65,000 | Settlement |
| 2020 | Dr. Rajendra Bhayani | $15,000 | Settlement |
| 2020 | Riverside Psychiatric Medical Group | $25,000 | Settlement |
| 2020 | City of New Haven, CT | $202,400 | Settlement |
| 2020 | Aetna | $1,000,000 | Settlement |
| 2020 | NY Spine | $100,000 | Settlement |
| 2020 | Dignity Health, dba St. Joseph’s Hospital and Medical Center | $160,000 | Settlement |
| 2020 | Premera Blue Cross | $6,850,000 | Settlement |
| 2020 | CHSPSC LLC | $2,300,000 | Settlement |
| 2020 | Athens Orthopedic Clinic PA | $1,500,000 | Settlement |
| 2020 | Housing Works, Inc. | $38,000 | Settlement |
| 2020 | All Inclusive Medical Services, Inc. | $15,000 | Settlement |
| 2020 | Beth Israel Lahey Health Behavioral Services | $70,000 | Settlement |
| 2020 | King MD | $3,500 | Settlement |
| 2020 | Wise Psychiatry, PC | $10,000 | Settlement |
| 2020 | Lifespan Health System Affiliated Covered Entity | $1,040,000 | Settlement |
| 2020 | Metropolitan Community Health Services dba Agape Health Services | $25,000 | Settlement |
| 2020 | Steven A. Porter, M.D | $100,000 | Settlement |
| 2019 | Jackson Health System | $2,154,000 | Civil Monetary Penalty |
| 2019 | Texas Department of Aging and Disability Services | $1,600,000 | Civil Monetary Penalty |
| 2019 | University of Rochester Medical Center | $3,000,000 | Settlement |
| 2019 | Touchstone Medical imaging | $3,000,000 | Settlement |
| 2019 | Sentara Hospitals | $2,175,000 | Settlement |
| 2019 | Medical Informatics Engineering | $100,000 | Settlement |
| 2019 | Korunda Medical, LLC | $85,000 | Settlement |
| 2019 | Bayfront Health St. Petersburg | $85,000 | Settlement |
| 2019 | West Georgia Ambulance | $65,000 | Settlement |
| 2019 | Elite Dental Associates | $10,000 | Settlement |
| 2018* | University of Texas MD Anderson Cancer Center | $4,348,000 | Civil Monetary Penalty |
| 2018 | Anthem Inc | $16,000,000 | Settlement |
| 2018 | Fresenius Medical Care North America | $3,500,000 | Settlement |
| 2018 | Massachusetts General Hospital | $515,000 | Settlement |
| 2018 | Brigham and Women’s Hospital | $384,000 | Settlement |
| 2018 | Boston Medical Center | $100,000 | Settlement |
| 2018 | Filefax, Inc. | $100,000 | Settlement |
| 2017 | Children’s Medical Center of Dallas | $3,200,000 | Civil Monetary Penalty |
| 2017 | Memorial Healthcare System | $5,500,000 | Settlement |
| 2017 | Cardionet | $2,500,000 | Settlement |
| 2017 | Memorial Hermann Health System | $2,400,000 | Settlement |
| 2017 | 21st Century Oncology | $2,300,000 | Settlement |
| 2017 | MAPFRE Life Insurance Company of Puerto Rico | $2,200,000 | Settlement |
| 2017 | Presense Health | $475,000 | Settlement |
| 2017 | Metro Community Provider Network | $400,000 | Settlement |
| 2017 | St. Luke’s-Roosevelt Hospital Center Inc. | $387,000 | Settlement |
| 2017 | The Center for Children’s Digestive Health | $31,000 | Settlement |
| 2016 | Lincare, Inc. | $239,800 | Civil Monetary Penalty |
| 2016 | Advocate Health Care Network | $5,550,000 | Settlement |
| 2016 | Feinstein Institute for Medical Research | $3,900,000 | Settlement |
| 2016 | University of Mississippi Medical Center | $2,750,000 | Settlement |
| 2016 | Oregon Health & Science University | $2,700,000 | Settlement |
| 2016 | New York Presbyterian Hospital | $2,200,000 | Settlement |
| 2016 | St. Joseph Health | $2,140,500 | Settlement |
| 2016 | North Memorial Health Care of Minnesota | $1,550,000 | Settlement |
| 2016 | Raleigh Orthopaedic Clinic, P.A. of North Carolina | $750,000 | Settlement |
| 2016 | University of Massachusetts Amherst (UMass) | $650,000 | Settlement |
| 2016 | Catholic Health Care Services of the Archdiocese of Philadelphia | $650,000 | Settlement |
| 2016 | Care New England Health System | $400,000 | Settlement |
| 2016 | Complete P.T., Pool & Land Physical Therapy, Inc. | $25,000 | Settlement |
| 2015 | Triple S Management Corporation | $3,500,000 | Settlement |
| 2015 | Lahey Hospital and Medical Center | $850,000 | Settlement |
| 2015 | University of Washington Medicine | $750,000 | Settlement |
| 2015 | Cancer Care Group, P.C. | $750,000 | Settlement |
| 2015 | St. Elizabeth’s Medical Center | $218,400 | Settlement |
| 2015 | Cornell Prescription Pharmacy | $125,000 | Settlement |
| 2014 | New York and Presbyterian Hospital and Columbia University | $4,800,000 | Settlement |
| 2014 | Concentra Health Services | $1,725,220 | Settlement |
| 2014 | Parkview Health System, Inc. | $800,000 | Settlement |
| 2014 | QCA Health Plan, Inc., of Arkansas | $250,000 | Settlement |
| 2014 | Skagit County, Washington | $215,000 | Settlement |
| 2014 | Anchorage Community Mental Health Services | $150,000 | Settlement |
| 2013 | WellPoint | $1,700,000 | Settlement |
| 2013 | Affinity Health Plan, Inc. | $1,215,780 | Settlement |
| 2013 | Idaho State University | $400,000 | Settlement |
| 2013 | Shasta Regional Medical Center | $275,000 | Settlement |
| 2013 | Adult & Pediatric Dermatology, P.C. | $150,000 | Settlement |
| 2012 | Alaska DHSS | $1,700,000 | Settlement |
| 2012 | Massachusetts Eye and Ear Infirmary and Massachusetts Eye and Ear Associates, Inc. | $1,500,000 | Settlement |
| 2012 | Blue Cross Blue Shield of Tennessee | $1,500,000 | Settlement |
| 2012 | Phoenix Cardiac Surgery | $100,000 | Settlement |
| 2012 | The Hospice of Northern Idaho | $50,000 | Settlement |
| 2011 | Cignet Health of Prince George’s County | $4,300,000 | Civil Monetary Penalty |
| 2011 | General Hospital Corp. & Massachusetts General Physicians Organization Inc. | $1,000,000 | Settlement |
| 2011 | University of California at Los Angeles Health System | $865,500 | Settlement |
| 2010 | Rite Aid Corporation | $1,000,000 | Settlement |
| 2010 | Management Services Organization Washington Inc. | $35,000 | Settlement |
| 2009 | CVS Pharmacy Inc. | $2,250,000 | Settlement |
| 2008 | Providence Health & Services | $100,000 | Settlement |
*In 2021, following an appeal, the civil monetary penalty imposed on the University of Texas MD Anderson Cancer Center by the HHS’ Office for Civil Rights was vacated.
Get The FREE
HIPAA Compliance Checklist
Immediate Delivery of Checklist Link To Your Email Address
Please enter correct email address
Your Privacy Respected
HIPAA Journal Privacy Policy
State Attorneys General HIPAA Fines and Other Financial Penalties for Healthcare Organizations
State attorneys general can bring actions against HIPAA-covered entities and their business associates for violations of the HIPAA Rules. Penalties range from $100 per HIPAA violation up to a maximum of $25,000 per violation category, per year.
Only a handful of U.S. states have imposed penalties for HIPAA violations; however, that changed in 2019 when many state Attorneys General started participating in multistate actions against HIPAA-covered entities and business associates that experienced major data breaches and were found not to be in compliance with the HIPAA Rules.
The penalties detailed below have been imposed by state attorneys general for HIPAA violations and violations of state laws. It is common for penalties to be imposed solely for violations of state laws, even though there are corresponding HIPAA violations.
Attorneys General HIPAA Fines (2008 – 2026)
| Year | State | Covered Entity | Amount |
| 2026 | Massachusetts & Connecticut | Comstar LLC | $515,000 |
| 2025 | New York | Orthopedics NY LLP | $500,000 |
| 2024 | Indiana | Westend Dental | $350,000 |
| 2024 | New York | HealthAlliance | $1,400,000 ($850,000 suspended) |
| 2024 | New York | Albany ENT & Allergy Specialists | $1,000,000 ($500,000 suspended); $2.25M investment in cybersecurity |
| 2024 | New York, New Jersey, Connecticut | Enzo Biochem/Enzo Clinical Labs | $4,500,000 |
| 2024 | Washington | Allure Esthetic | $5,000,000 |
| 2024 | California | Adventist Health Hanford | $10,000 |
| 2024 | California | Blackbaud | $6,750,000 |
| 2024 | California | Quest Diagnostics | $5,000,000 |
| 2024 | New York | Refuah Health Center | $450,000 and an investment of $1.2 million in cybersecurity |
| 2023 | New York | New York Presbyterian Hospital | $300,000 |
| 2023 | New York | Healthplex | $400,000 |
| 2023 | Indiana | CarePointe ENT | $120,000 |
| 2023 | New York | U.S. Radiology Specialists Inc. | $450,000 |
| 2023 | Multistate (32 states and PR) | Inmediata | $1,400,000 |
| 2023 | New York | Personal Touch Holding Corp | $350,000 |
| 2023 | Multistate (49 states and DC) | Blackbaud | $49,500,000 |
| 2023 | Colorado | Broomfield Skilled Nursing and Rehabilitation Center | $60,000 ($25,000 suspended) |
| 2023 | Indiana | Schneck Medical Center | $250,000 |
| 2023 | California | Kaiser Foundation Health Plan Foundation Inc. and Kaiser Foundation Hospitals | $49,000,000 |
| 2023 | California | Kaiser Permanente | $450,000 |
| 2023 | New York | Professional Business Systems Inc. dba Practicefirst Medical Management Solutions | $550,000 |
| 2023 | Multi-state: Oregon, New Jersey, Florida, Pennsylvania | EyeMed Vision Care | $2,500,000 |
| 2023 | New York | Heidell, Pittoni, Murphy & Bach LLP | $200,000 |
| 2023 | Pennsylvania & Ohio | DNA Diagnostics Center | $400,000 |
| 2022 | Oregon & Utah | Avalon Healthcare | $200,000 |
| 2022 | Massachusetts | Aveanna Healthcare | $425,000 |
| 2022 | New York | EyeMed Vision Care | $600,000 |
| 2021 | New Jersey | Regional Cancer Care Associates (Regional Cancer Care Associates LLC, RCCA MSO LLC, and RCCA MD LLC) | $425,000 |
| 2021 | New Jersey | Regional Cancer Care Associates (Regional Cancer Care Associates LLC, RCCA MSO LLC, and RCCA MD LLC) | $425,000 |
| 2021 | New Jersey | Diamond Institute for Infertility and Menopause | $495,000 |
| 2021 | Multistate | American Medical Collection Agency | $21 million (suspended) |
| 2020 | Multistate | CHSPSC LLC | $5,000,000 |
| 2020 | Multistate | Anthem Inc. | $39.5 million |
| 2020 | California | Anthem Inc. | $8.7 million |
| 2019 | Multistate | Premera Blue Cross | $10,000,000 |
| 2019 | Multistate | Medical Informatics Engineering | $900,000 |
| 2019 | California | Aetna | $935,000 |
| 2018 | Massachusetts | McLean Hospital | $75,000 |
| 2018 | New Jersey | EmblemHealth | $100,000 |
| 2018 | New Jersey | Best Transcription Medical | $200,000 |
| 2018 | Connecticut | Aetna | $99,959 |
| 2018 | New Jersey | Aetna | $365,211.59 |
| 2018 | District of Columbia | Aetna | $175,000 |
| 2018 | Massachusetts | UMass Memorial Medical Group / UMass Memorial Medical Center | $230,000 |
| 2018 | New York | Arc of Erie County | $200,000 |
| 2018 | New Jersey | Virtua Medical Group | $417,816 |
| 2018 | New York | EmblemHealth | $575,000 |
| 2018 | New York | Aetna | $1,150,000 |
| 2017 | California | Cottage Health System | $2,000,000 |
| 2017 | Massachusetts | Multi-State Billing Services | $100,000 |
| 2017 | New Jersey | Horizon Healthcare Services Inc., | $1,100,000 |
| 2017 | Vermont | SAManage USA, Inc. | $264,000 |
| 2017 | New York | CoPilot Provider Support Services, Inc | $130,000 |
| 2015 | New York | University of Rochester Medical Center | $15,000 |
| 2015 | Connecticut | Hartford Hospital/ EMC Corporation | $90,000 |
| 2014 | Massachusetts | Women & Infants Hospital of Rhode Island | $150,000 |
| 2014 | Massachusetts | Boston Children’s Hospital | $40,000 |
| 2014 | Massachusetts | Beth Israel Deaconess Medical Center | $100,000 |
| 2013 | Massachusetts | Goldthwait Associates | $140,000 |
| 2012 | MN | Accretive Health | $2,500,000 |
| 2012 | Massachusetts | South Shore Hospital | $750,000 |
| 2011 | Vermont | Health Net Inc. | $55,000 |
| 2011 | Indiana | WellPoint Inc. | $100,000 |
| 2010 | Connecticut | Health Net Inc. | $250,000 |
Click for further information HIPAA enforcement by State Attorneys General.
Federal Trade Commission Fines and Penalties
In 2009, the Federal Trade Commission (FTC) published a new rule that required vendors of personal health records and related entities to notify consumers following a breach involving unsecured information. The FTC Health Breach Notification Rule applies only to identifying health information that is not covered by HIPAA. The Rule does not apply to HIPAA-covered entities or business associates, which have reporting requirements per the HIPAA Breach Notification Rule.
The FTC issued a policy update in 2021 stating its intention to start actively enforcing compliance. Prior to 2023, no financial penalties had been imposed for breach notification failures, but that changed in February 2023.
| Entity | Company Type | Penalty Type | Amount | Reason |
| Cerebral | Mental health telehealth company | Settlement | $7.1 million ($10 million CMP, $8 million suspended. $5.1 million in refunds to customers) | Impermissible disclosure of personal and health information to third parties such as Google and Snapchat |
| Monument | Alcohol addiction treatment company | Settlement | $2.5 million (suspended) | Impermissible disclosure of personal and health information to third parties, such as Google. |
| Easy Healthcare (Premom) | Fertility tracking health app provider | Settlement | $200,000 | Impermissible disclosure of personal and health information to third parties such as Google and Facebook. Failure to issue timely notifications |
| BetterHelp Inc. | Online counseling service provider | Settlement | $7,800,000 | Impermissible disclosure of personal and health information to third parties such as Google and Facebook |
| GoodRx Holdings Inc. | Telemedicine platform provider | Settlement | $1,500,000 | Failure to notify consumers about the impermissible disclosure of personal and health information to third parties such as Google and Facebook |
Healthcare Data Breach Statistics FAQs
How does the number of data breaches in the healthcare sector compare with other sectors?
The number of data breaches in the healthcare sector compares poorly with other sectors. An analysis of data breaches recorded on the Privacy Rights database between 2015 and 2022 showed that 32% of all recorded data breaches were in the healthcare sector – almost double the number recorded in the financial and manufacturing sectors.

Why are there so many more data breaches in the healthcare sector than in other sectors?
There are so many more data breaches in the healthcare sector than in other sectors because healthcare data is more valuable on the black market than any other type of data. This is because it takes longer for healthcare fraud to be discovered and stolen data can be used for longer compared to (for example) a stolen credit card which can be stopped as soon as the breach is discovered.
It is also the case that organizations in the healthcare sector have stricter breach notification requirements than in other sectors. Certain types of breaches (i.e., ransomware attacks) have to be reported even if it cannot be established data has been compromised. The increasing number of recent ransomware attacks may have influenced the healthcare data breach statistics.
Why has the average HIPAA penalty decreased since 2018 despite increases in the number of breaches and median breach size?
The average HIPAA penalty has decreased since 2018 despite increases in the number of breaches and median breach size because in recent years the Office for Civil Rights (OCR) has been running a right of access initiative to clamp down on providers who fail to provide patients with access to their PHI within the thirty days allowed.
Penalties for right of access failures are less than for high-volume data breaches, and this has resulted in a decrease in the average HIPAA penalty in recent years. However, while the average HIPAA penalty issued by OCR has decreased, penalties issued by State Attorneys General have remained constant, while it is too early to find trends in fines issued by the FTC.
If a healthcare professional discloses PHI without authorization, is this included in the healthcare data breach statistics?
If a healthcare professional discloses PHI without authorization, the disclosure is unlikely to appear in the healthcare data breach statistics because the statistics are compiled from breaches involving 500 or more records. Therefore, individual unauthorized disclosures of PHI are not included in the figures. However, if the unauthorized disclosure is investigated by OCR and found to be attributable to willful neglect, any subsequent fines will be included in the settlement statistics.
How can healthcare organizations mitigate data breaches?
Healthcare organizations can mitigate data breaches using various methods. The most effective is to encrypt protected health information to render it unusable, unreadable, or indecipherable in the event of a data breach attack. This will ensure data is not compromised and the attack will not have to be reported to the Office for Civil Rights.
Other steps include implementing two-factor authentication on privileged accounts to mitigate the consequences of credential theft, running checks on all storage volumes (cloud and on-premises) to ensure appropriate permissions are applied, checking network connections for unauthorized open ports, and eliminating Shadow IT environments developed as workarounds.
How are successful phishing attacks recorded in the HIPAA breach reports?
Successful phishing attacks are recorded in the HIPAA breach reports as Hacking/IT Incidents. However, as other cybersecurity incidents such as ransomware attacks and events attributable to malware are also categorized as Hacking/IT Incidents, it is not possible to determine how many successful phishing attacks there have been affecting more than 500 individuals.
Why doesn’t HHS fine every covered organization when a HIPAA data breach occurs?
HHS doesn’t fine every covered organization when a HIPAA data breach occurs because not all data breaches are attributable to HIPAA violations. For example, successful ransomware attacks are notifiable events even when no PHI is disclosed and when systems can be quickly restored from backups because, for a period of time, PHI was unavailable.
Why is the number of HIPAA breaches increasing despite more awareness about HIPAA compliance?
The number of HIPAA breaches is increasing despite more awareness about HIPAA compliance due to the increasing digitalization of healthcare data and the increasing sophistication of cyberattacks. While there is an argument that more awareness about HIPAA compliance is having an impact on the lower number of HIPAA breaches attributable to lost or stolen drives and devices, there is a counterargument that, because of the increase in cloud computing, fewer covered organizations are transporting unencrypted PHI on drives and devices.
How can HIPAA covered entities better secure their supply chains to prevent data breaches attributable to business associates?
HIPAA covered entities can better secure their supply chains to prevent data breaches attributable to business associates by conducting more thorough due diligence on each business associate. Many covered entities rely on “good faith assurances” rather than investigating the measures each business associate has in place to prevent data breaches, the training provided to business associate workforces, and the security of communication channels used to transmit PHI.

What is the difference between a healthcare data breach and a HIPAA data breach?
The difference between a healthcare data breach and a HIPAA data breach is that a healthcare data breach is one in which healthcare data is accessed without authorization from a healthcare provider (who may or may not be a HIPAA covered entity or business associate), while a HIPAA data breach is a breach of any Protected Health Information (which can include financial information) from any covered health plan, health care clearinghouse, or healthcare provider, or any business associate providing a service for or on behalf of a covered entity.
Therefore, not only is it the nature of the data that distinguishes a healthcare data breach from a HIPAA data breach (i.e., healthcare data vs healthcare, payment, and other data with protected status), but also the status of the organization where data was accessed without authorization (i.e., covered or non-covered healthcare provider vs HIPAA covered entity or business associate). The difference may be subtle, but it can impact the breach notification requirements, the regulatory authority, and the penalty for a data breach.
